
Crypto analyst and trader Ali Martinez is warning that Bitcoin (BTC) may not be done correcting despite the recent bounce.
Martinez tells his 135,000 followers on the social media platform X that market indicators, including a “death cross” on the daily timeframe, suggest Bitcoin is not convincingly breaking out.
A death cross in technical analysis occurs when the 50-day moving average (MA) drops below the 200-day MA and is used to identify a weakening market.
“While the recent Bitcoin bounce has been strong, the higher time frames suggest caution:
- Death cross recently formed on the daily chart.
- SuperTrend indicator still shows ‘Sell.’
- Monthly open at $82,500 acting as resistance.
- Descending trendline from all-time high sits around $84,000.
- 50-day moving average at $85,800.
- 200-day moving average at $87,000.”
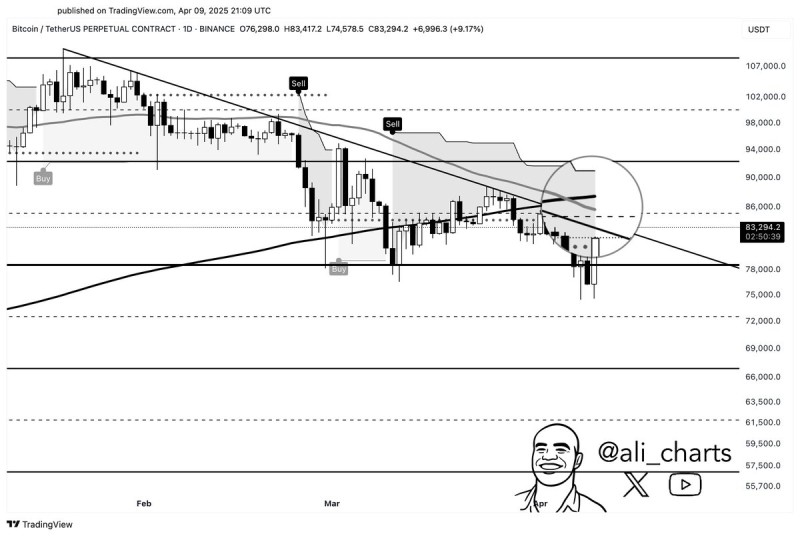
Source: Ali Martinez/X
Looking to the upside, Glassnode says that based on the historical precedent of the Market Value to Realized Value (MVRV), the flagship crypto asset faces a key resistance level at $94,500.
The MVRV is the ratio of Bitcoin’s market capitalization compared to its realized capitalization – the value of all Bitcoin at the price they were bought at.
The MVRV’s extreme deviation pricing bands are used to determine possible market bottoms and tops, with the 1.0 standard deviation being the upper band and -1.0 standard deviation being the lower band.
“As Bitcoin rebounds, the next immediate resistance stands at $94,500, according to pricing bands.”
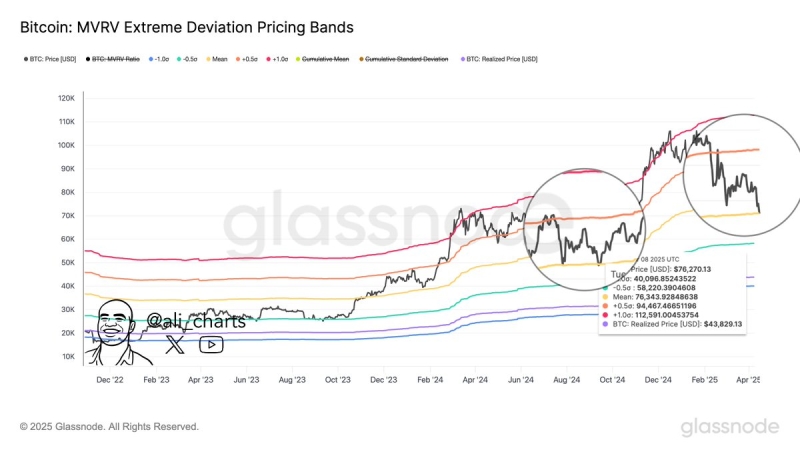
Source: Ali Martinez/X
Lastly, the analyst says that Bitcoin may see a massive rally if the top digital asset by market cap can reclaim $86,900 as support based on the Mayer Multiple.
The Mayer Multiple is a technical tool that measures the difference between the current price of BTC and the 200-day moving average to determine if Bitcoin is overbought or oversold.
“Based on the Mayer Multiple, Bitcoin could find solid support around $69,500. And, a breakout above $86,900 might set the stage for a market top near $208,550.”
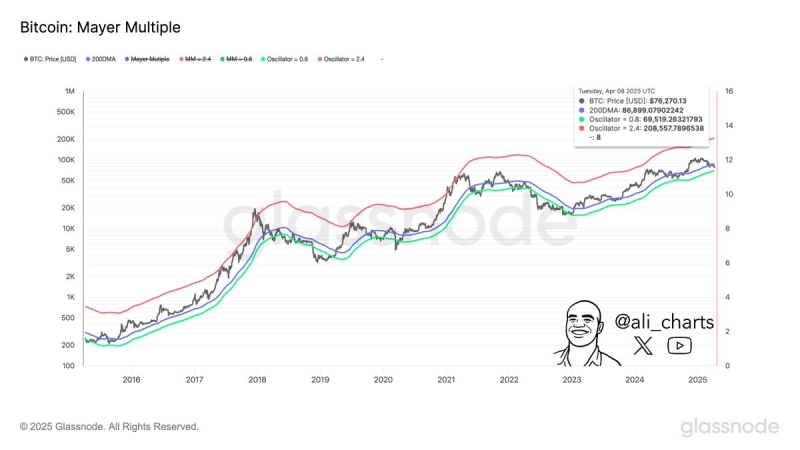
Source: Ali Martinez/X
Bitcoin is trading for $79,829 at time of writing, down 3.9% in the last 24 hours.

